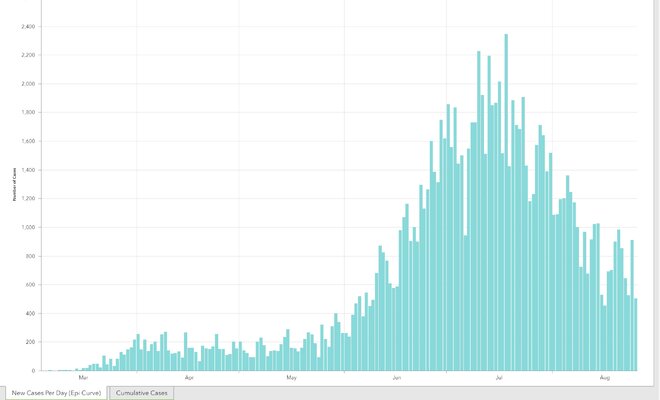
I know what a curve looks like. Especially one that is waning. I cannot say why it is, but it is. I'm happy about that. Here's SC DHEC's graph of Covid Cases. We're now reporting around 500 NEW cases each day. A few weeks ago it was over 1,000 per day. In our county alone, the lowest amount of cases in the state, they say new confirmed cases per day for all this week and last week were like 14, 18, 21, 15, etc. A death here and there, but people aren't dropping like flies. Our new case rate is similar to what it was the first part of June, or roughly 10 weeks ago. And testing is darn near everywhere around here now.
Is it mask wearing? I dunno. I don't care. I think whatever we're doing, we're doing well. The recent dubbing of SC as a "hot spot" is now bullcrap, IMO. It may be spiking here and there, but barring anything strange, I think we're getting this sh*t under control. I suspect that's happening in a lot of places. Must be the protesting. 🙂 Covid won't go near protesting. Hospitals were nearing ICU capacity in the summer, but now none are reporting any overcrowding at all. And many hospitals are doing non-critical surgeries again.
Latest graph:


